.jpg)


 |
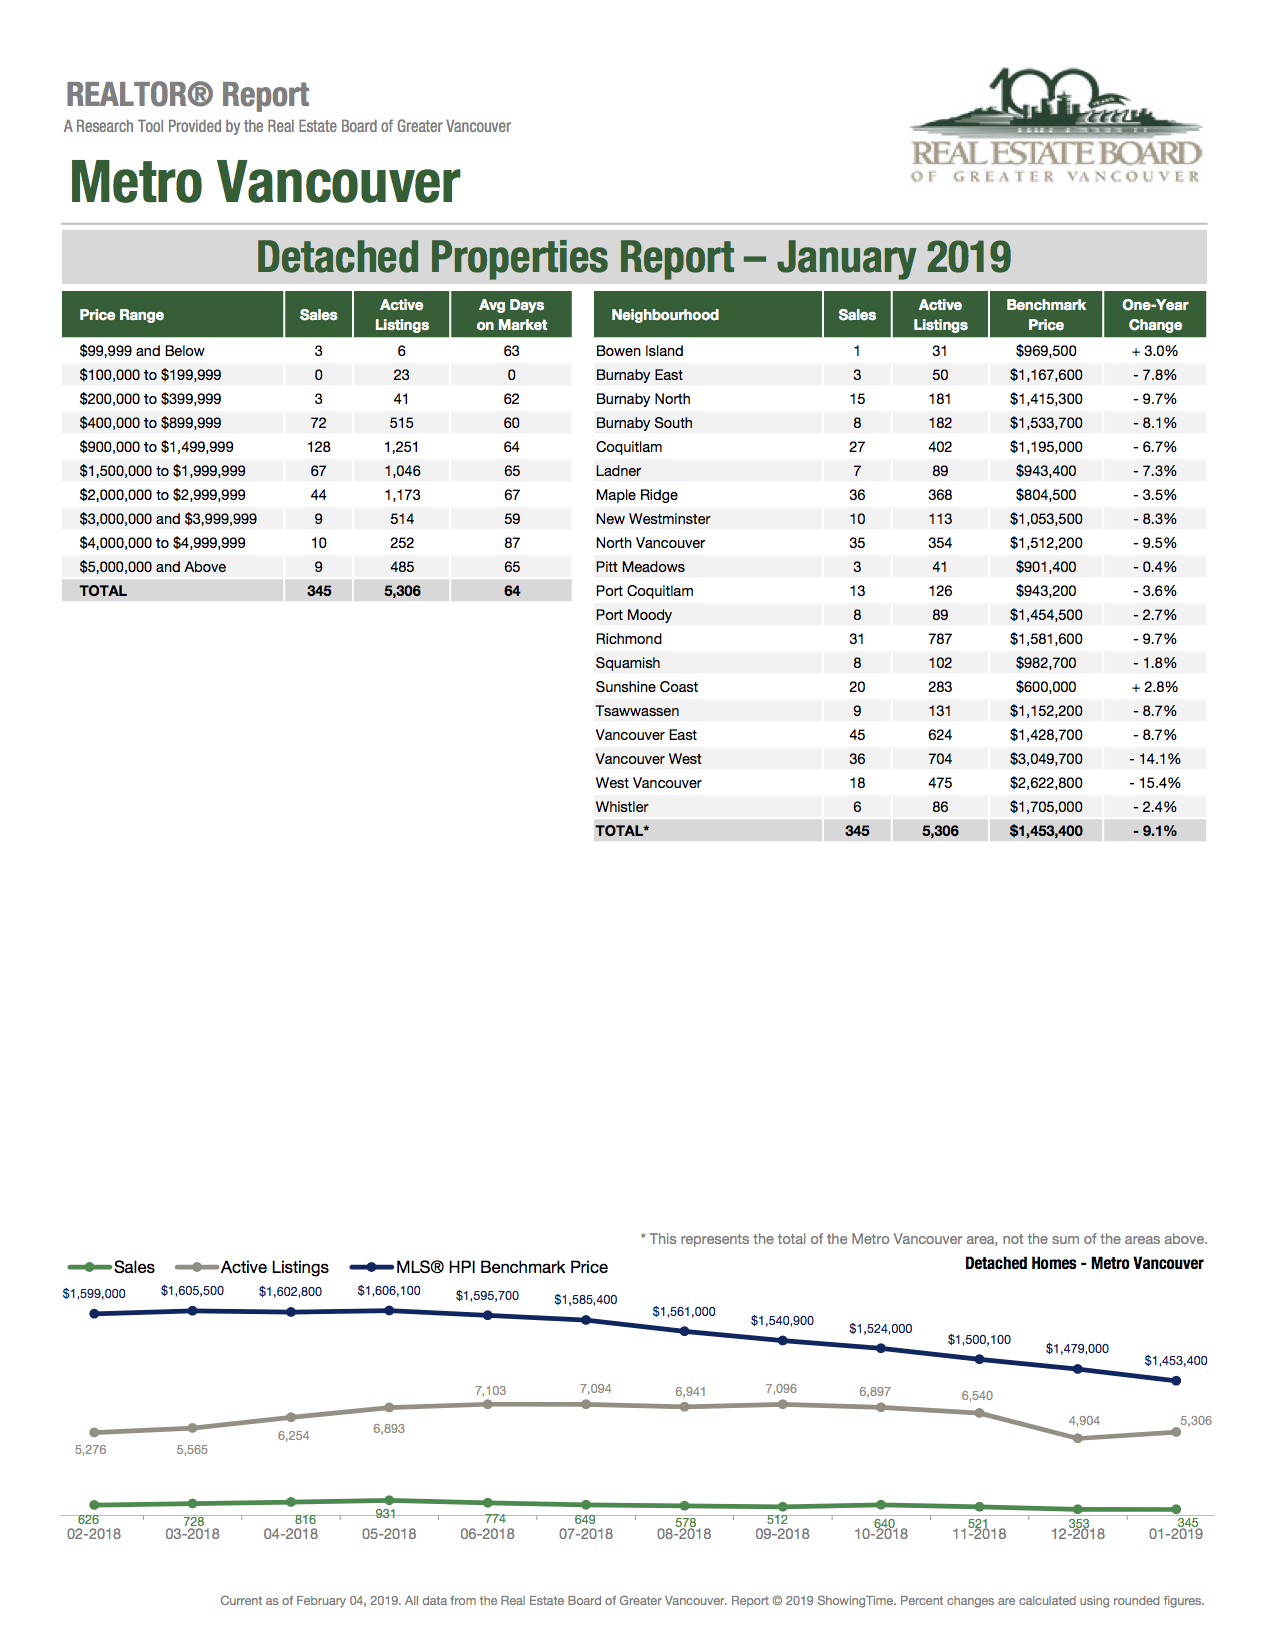
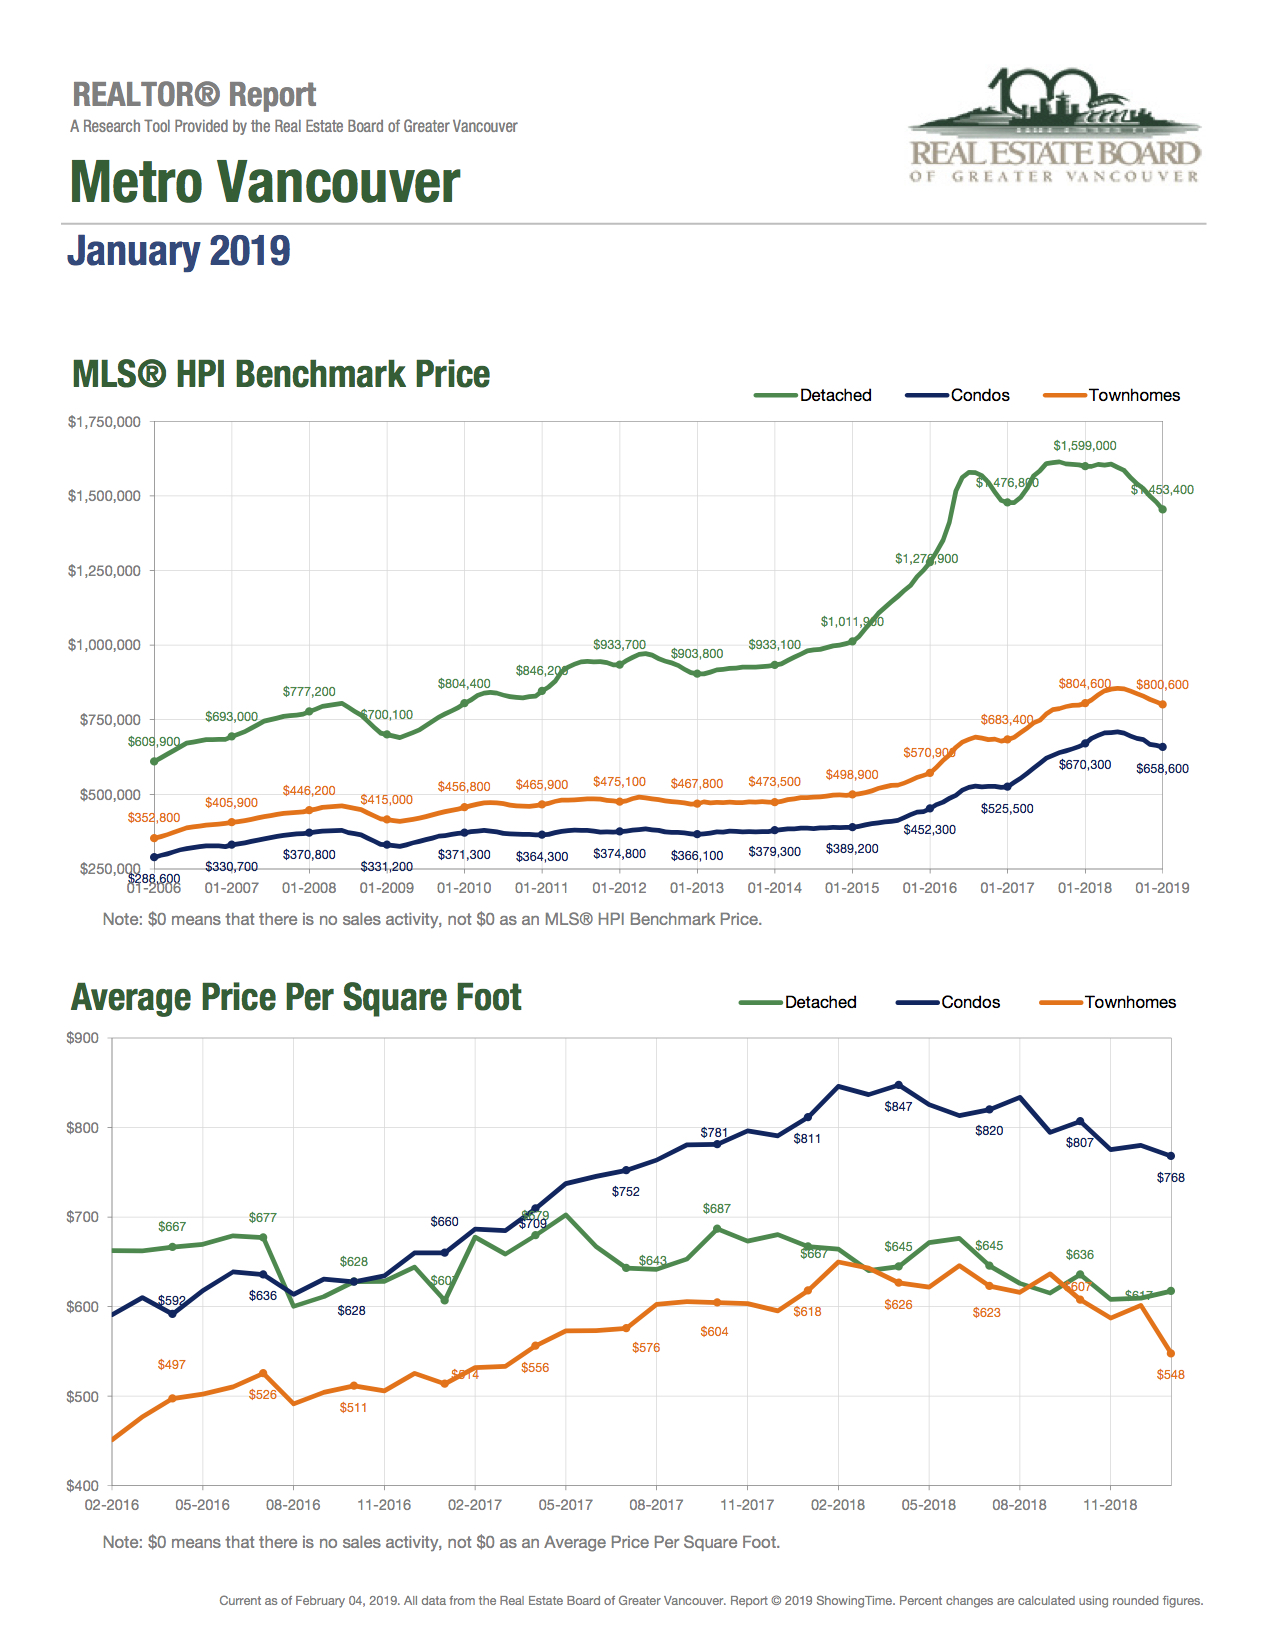
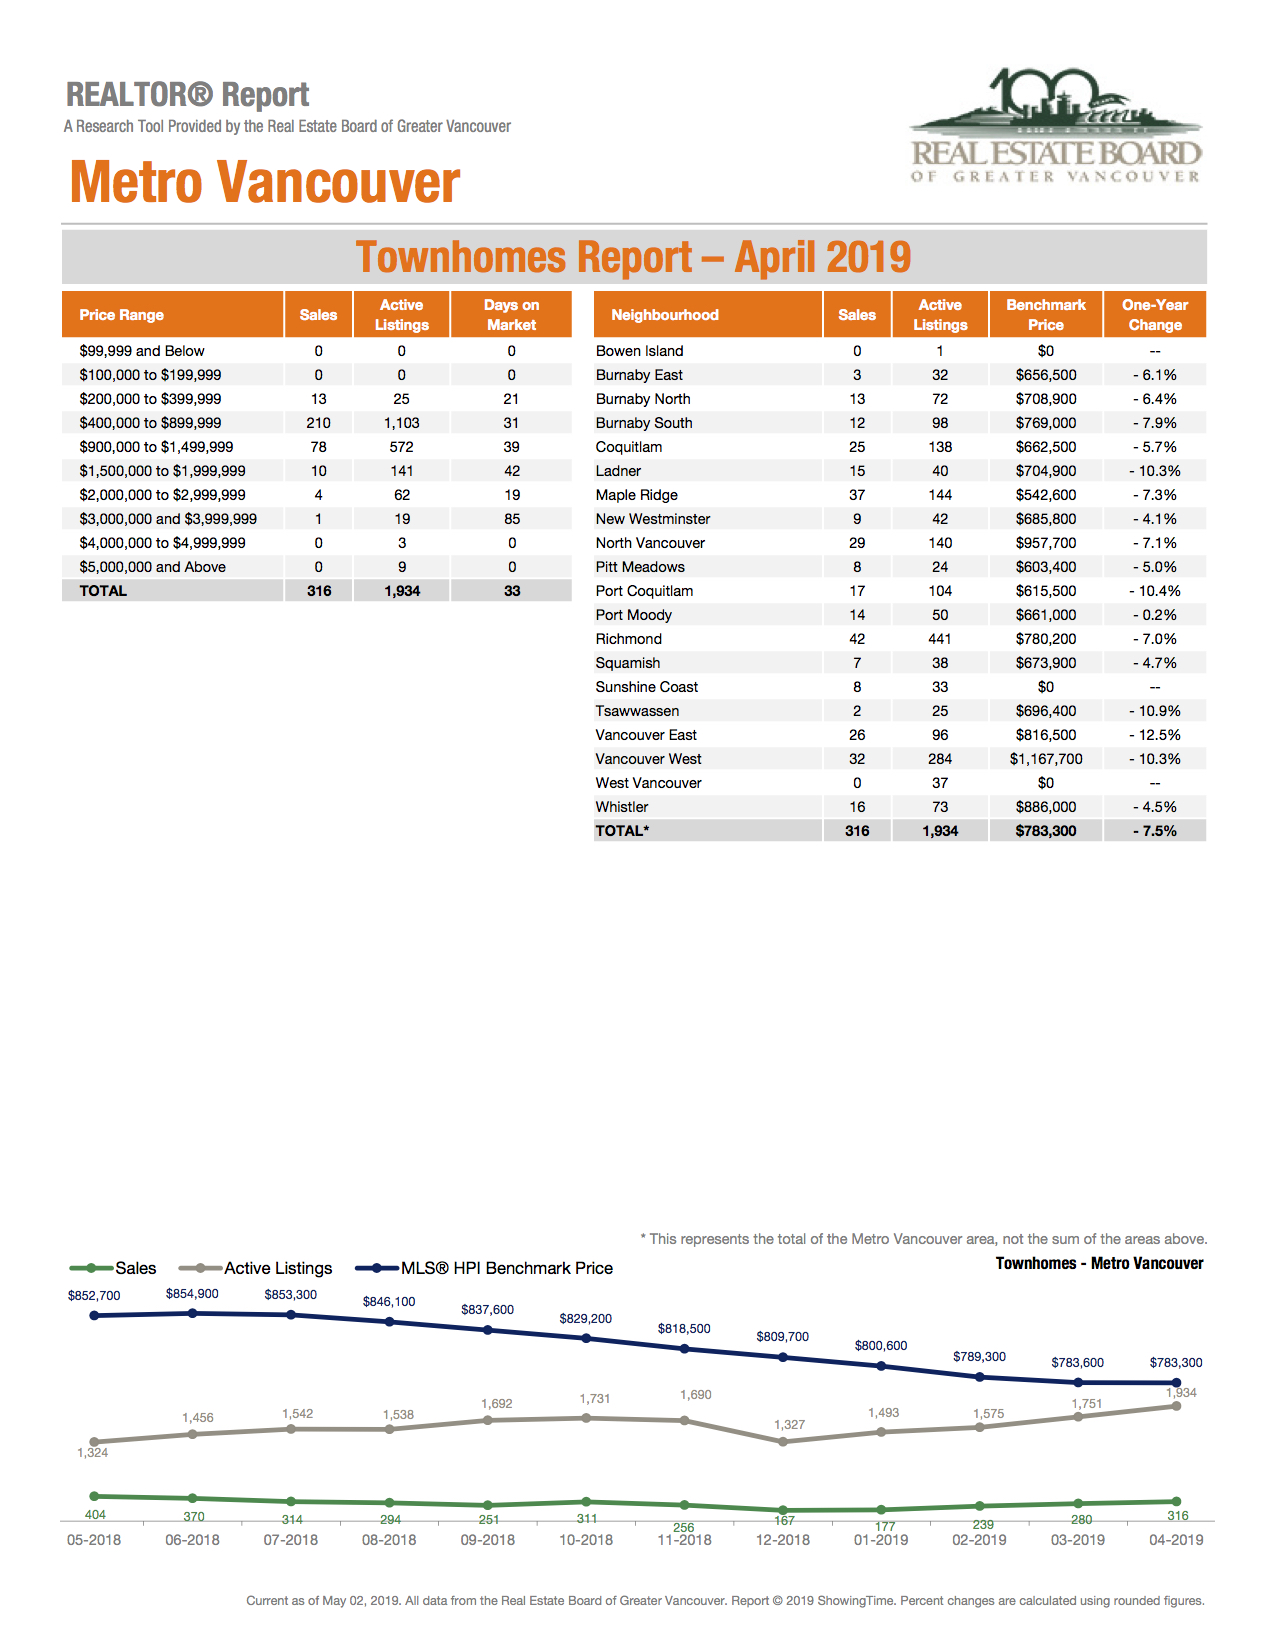
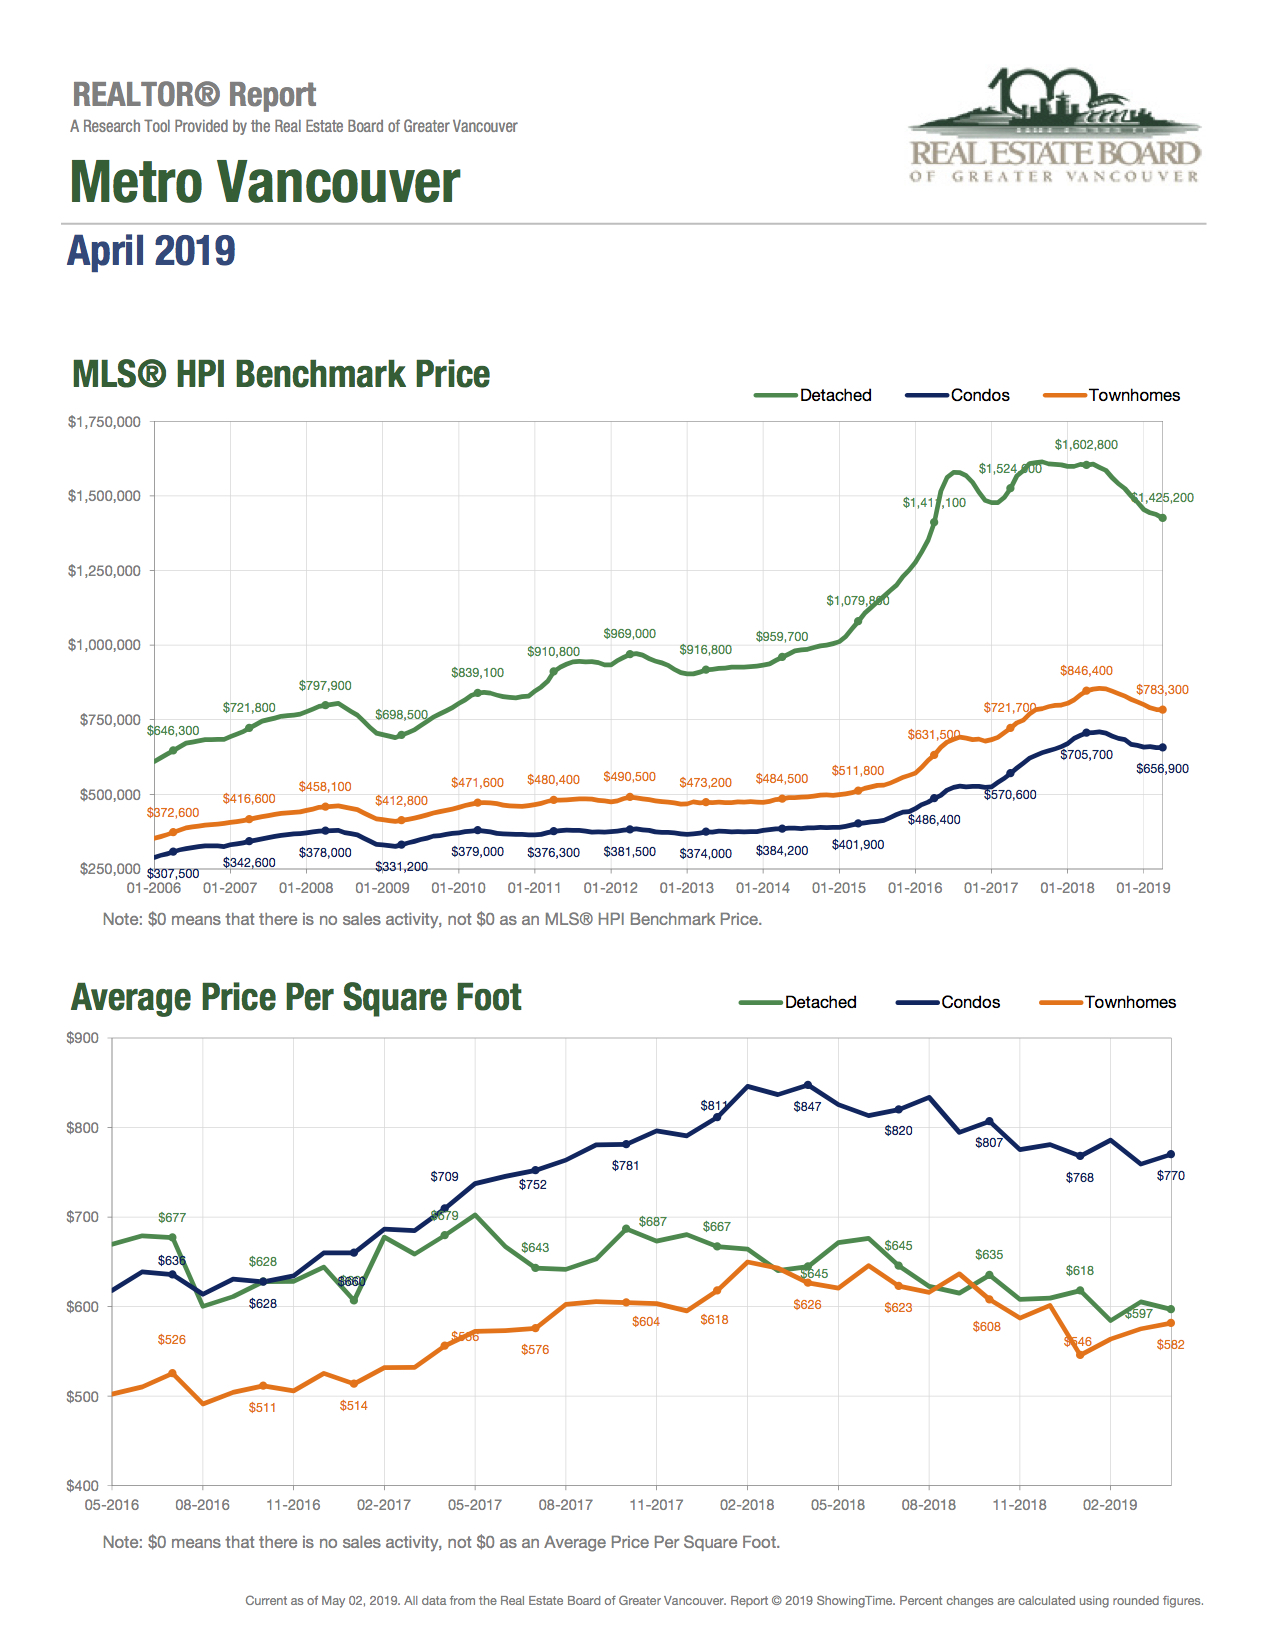
Reduced demand and increased supply remain the trend across Metro Vancouver’s housing marketDecreased demand continues to allow the supply of homes for sale to accumulate across the Metro Vancouver housing market. The Real Estate Board of Greater Vancouver (REBGV) reports that residential home sales in the region totalled 1,829 in April 2019, a 29.1 per cent decrease from the 2,579 sales recorded in April 2018, and a 5.9 per cent increase from the 1,727 homes sold in March 2019. Last month’s sales were 43.1 per cent below the 10-year April sales average. “Government policy continues to hinder home sale activity. The federal government’s mortgage stress test has reduced buyers’ purchasing power by about 20 per cent, which is causing people at the entry-level side of the market to struggle to secure financing,” Ashley Smith, REBGV president said. “Suppressing housing activity through government policy not only reduces home sales, it harms the job market, economic growth and creates pent-up demand.” There were 5,742 detached, attached and apartment properties newly listed for sale on the Multiple Listing Service® (MLS®) in Metro Vancouver in April 2019. This represents a 1.3 per cent decrease compared to the 5,820 homes listed in April 2018 and a 16 per cent increase compared to March 2019 when 4,949 homes were listed. The total number of homes currently listed for sale on the MLS® in Metro Vancouver is 14,357, a 46.2 per cent increase compared to April 2018 (9,822) and a 12.4 per cent increase compared to March 2019 (12,774). “There are more homes for sale in our market today than we’ve seen since October 2014. This trend is more about reduced demand than increased supply,” Smith said. “The number of new listings coming on the market each month are consistent with our long-term averages. It’s the reduced sales activity that’s allowing listings to accumulate.” The overall sales-to-active listings ratio for April 2019 is 12.7 per cent. By property type, the ratio is 9.4 per cent for detached homes, 15.4 per cent for townhomes, and 15.3 per cent for apartments. Generally, analysts say downward pressure on home prices occurs when the ratio dips below 12 per cent for a sustained period, while home prices often experience upward pressure when it surpasses 20 per cent over several months. The MLS® Home Price Index composite benchmark price for all residential properties in Metro Vancouver is currently $1,008,400. This represents an 8.5 per cent decrease over April 2018, and a 0.3 per cent decrease compared to March 2019. Detached home sales totalled 586 in April 2019, a 27.4 per cent decrease from the 807 detached sales in April 2018. The benchmark price for a detached home is $1,425,200. This represents an 11.1 per cent decrease from April 2018, a 0.8 per cent decrease compared to March 2019. Apartment home sales totalled 885 in April 2019, a 32.3 per cent decrease compared to the 1,308 sales in April 2018. The benchmark price of an apartment is $656,900 in the region. This represents a 6.9 per cent decrease from April 2018 and is unchanged from March 2019. Attached home sales totalled 358 in April 2019, a 22.8 per cent decrease compared to the 464 sales in April 2018. The benchmark price of an attached home is $783,300. This represents a 7.5 per cent decrease from April 2018 and is unchanged from March 2019. Download the April 2019 stats package. |

 |
|
|
Prospective home buyers remain on the sidelines in MarchMetro Vancouver home sales dipped to the lowest levels seen in March in more than three decades. The Real Estate Board of Greater Vancouver (REBGV) reports that residential home sales in the region totalled 1,727 in March 2019, a 31.4 per cent decrease from the 2,517 sales recorded in March 2018, and a 16.4 per cent increase from the 1,484 homes sold in February 2019. Last month’s sales were 46.3 per cent below the 10-year March sales average and was the lowest total for the month since 1986. “Housing demand today isn’t aligning with our growing economy and low unemployment rates. The market trends we’re seeing are largely policy induced,” Ashley Smith, REBGV president said. “For three years, governments at all levels have imposed new taxes and borrowing requirements on to the housing market.” “What policymakers are failing to recognize is that demand-side measures don’t eliminate demand, they sideline potential home buyers in the short term. That demand is ultimately satisfied down the line because shelter needs don’t go away. Using public policy to delay local demand in the housing market just feeds disruptive cycles that have been so well-documented in our region.” There were 4,949 detached, attached and apartment properties newly listed for sale on the Multiple Listing Service® (MLS®) in Metro Vancouver in March 2019. This represents an 11.2 per cent increase compared to the 4,450 homes listed in March 2018 and a 27.2 per cent increase compared to February 2019 when 3,892 homes were listed. The total number of homes currently listed for sale on the MLS® system in Metro Vancouver is 12,774, a 52.4 per cent increase compared to March 2018 (8,380) and a 10.2 per cent increase compared to February 2019 (11,590). For all property types, the sales-to-active listings ratio for March 2019 is 13.5 per cent. By property type, the ratio is 9.4 per cent for detached homes, 15.9 per cent for townhomes, and 17.2 per cent for apartments. Generally, analysts say downward pressure on home prices occurs when the ratio dips below 12 per cent for a sustained period, while home prices often experience upward pressure when it surpasses 20 per cent over several months. The MLS® Home Price Index composite benchmark price for all residential properties in Metro Vancouver is currently $1,011,200. This represents a 7.7 per cent decrease from March 2018, and a 0.5 per cent decrease compared to February 2019. Sales of detached homes in March 2019 reached 529, a 26.7 per cent decrease from the 722 sales in March 2018. The benchmark price for a detached home is $1,437,100. This represents a 10.5 per cent decrease from March 2018, and a 0.4 per cent decrease compared to February 2019. Sales of apartment homes reached 873 in March 2019, a 35.3 per cent decrease compared to the 1,349 sales in March 2018. The benchmark price of an apartment property is $656,900. This represents a 5.9 per cent decrease from March 2018, and a 0.5 per cent decrease compared to February 2019. Attached home sales in March 2019 totalled 325, a 27.1 per cent decrease compared to the 446 sales in March 2018. The benchmark price of an attached home is $783,600. This represents a six per cent decrease from March 2018, and a 0.7 per cent decrease compared to February 2019. Download the March 2019 stats package. |
|
The latest Stats Centre Report for Metro Vancouver is now available. To view it, click here. To view the latest Stats Centre Report for Vancouver East, click here. If you'd like to see reports for other areas within the Board, click here(password required). We've created these reports for you to share with your clients each month. |

With the first day of Spring, the thirteen day Festival called Sizdah Bedar begins. It is also known as Nature's Day and is celebrated by spending time outdoors and enjoying Nature with family and friends. In our ad this week in Daneshmand Magazine, we posted a touching story about how the famous Persian nuclear physicist, Dr. Mahmoud Hesabi, explains the meaning of Naw-Ruz and the Haft-Sin to Albert Einstein and other professors at his Naw-Ruz celebration. The Haft-Sin is a traditional way of commemorating the New Year, by decoratively placing seven items on a table that begin with the letter "seen" in the Persian alphabet. However, according to Dr. Hesabi, the Haft-Sin used to be called Haft-Chin, which actually means "picking" or"harvesting", and each symbolic item has a spiritual meaning associated with it.
These items of the Haft-Chin and their meanings are:
1. Sabzeh (sprouts), representing growth.
2. Mahi (goldfish), representing movement.
3. Ayneh (mirror), representing sincerity, to be oneself, not being two faced.
4. Sham (candle), representing birth and death. For each guest that is present at the celebration, a candle is lit. While we may approximately know when one is to be born, we do not know ones death. It's destiny.
5. Niloofar (Lotus flower), the Lotus flower comes out from the dirt of the pond, yet it blooms in outmost purity. This represents the purity of the transformation that takes place in the human spirit, from materialism to the higher self.
6. Moose ghee Irani (classical Persian music). It is more than just music, it uplifts the spirit and speaks from the heart. It is a kind of philosophy, a way of thinking, an expression of hope and desire.
7. A bowl of water with an orange floating inside of it, representing the Earth in Space.
Einstein was the most surprised about this last point, when Dr. Hesabi explained that this visualization was present from 10,000 years ago, meaning that the civilizations at the time already knew that the Earth was round.
Reference: https://welcometoiran.com/mahmoud-hesabi/
.jpg)


|